TL;DR: A modern analytics stack with dlt and Holistics to transform and ingest unstructured production data from MongoDB to flat tables in BigQuery for self-service analytics.
If you’re a CTO, then you probably love MongoDB: it’s scalable, production-ready, and a great dump for unstructured, and semi-structured data. If you’re however a data scientist or data analyst and you need to run analytics on top of MongoDB data dumps, then you’re probably not a fan. The data in MongoDB needs to be transformed and stored in a data warehouse before it is ready for analytics. The process of transforming and storing the data can become quite tedious due to the unstructured nature of the data.
In this blog, we will show you how you can combine dlt and Holistics and create a modern data stack that makes the process of extracting unstructured data from MongoDB, and running self-service analytics on the data simple and straightforward. We will use dlt to ingest the Movie Flix Dataset into BigQuery from MongoDB and use Holistics to transform the data and run self-service analytics.
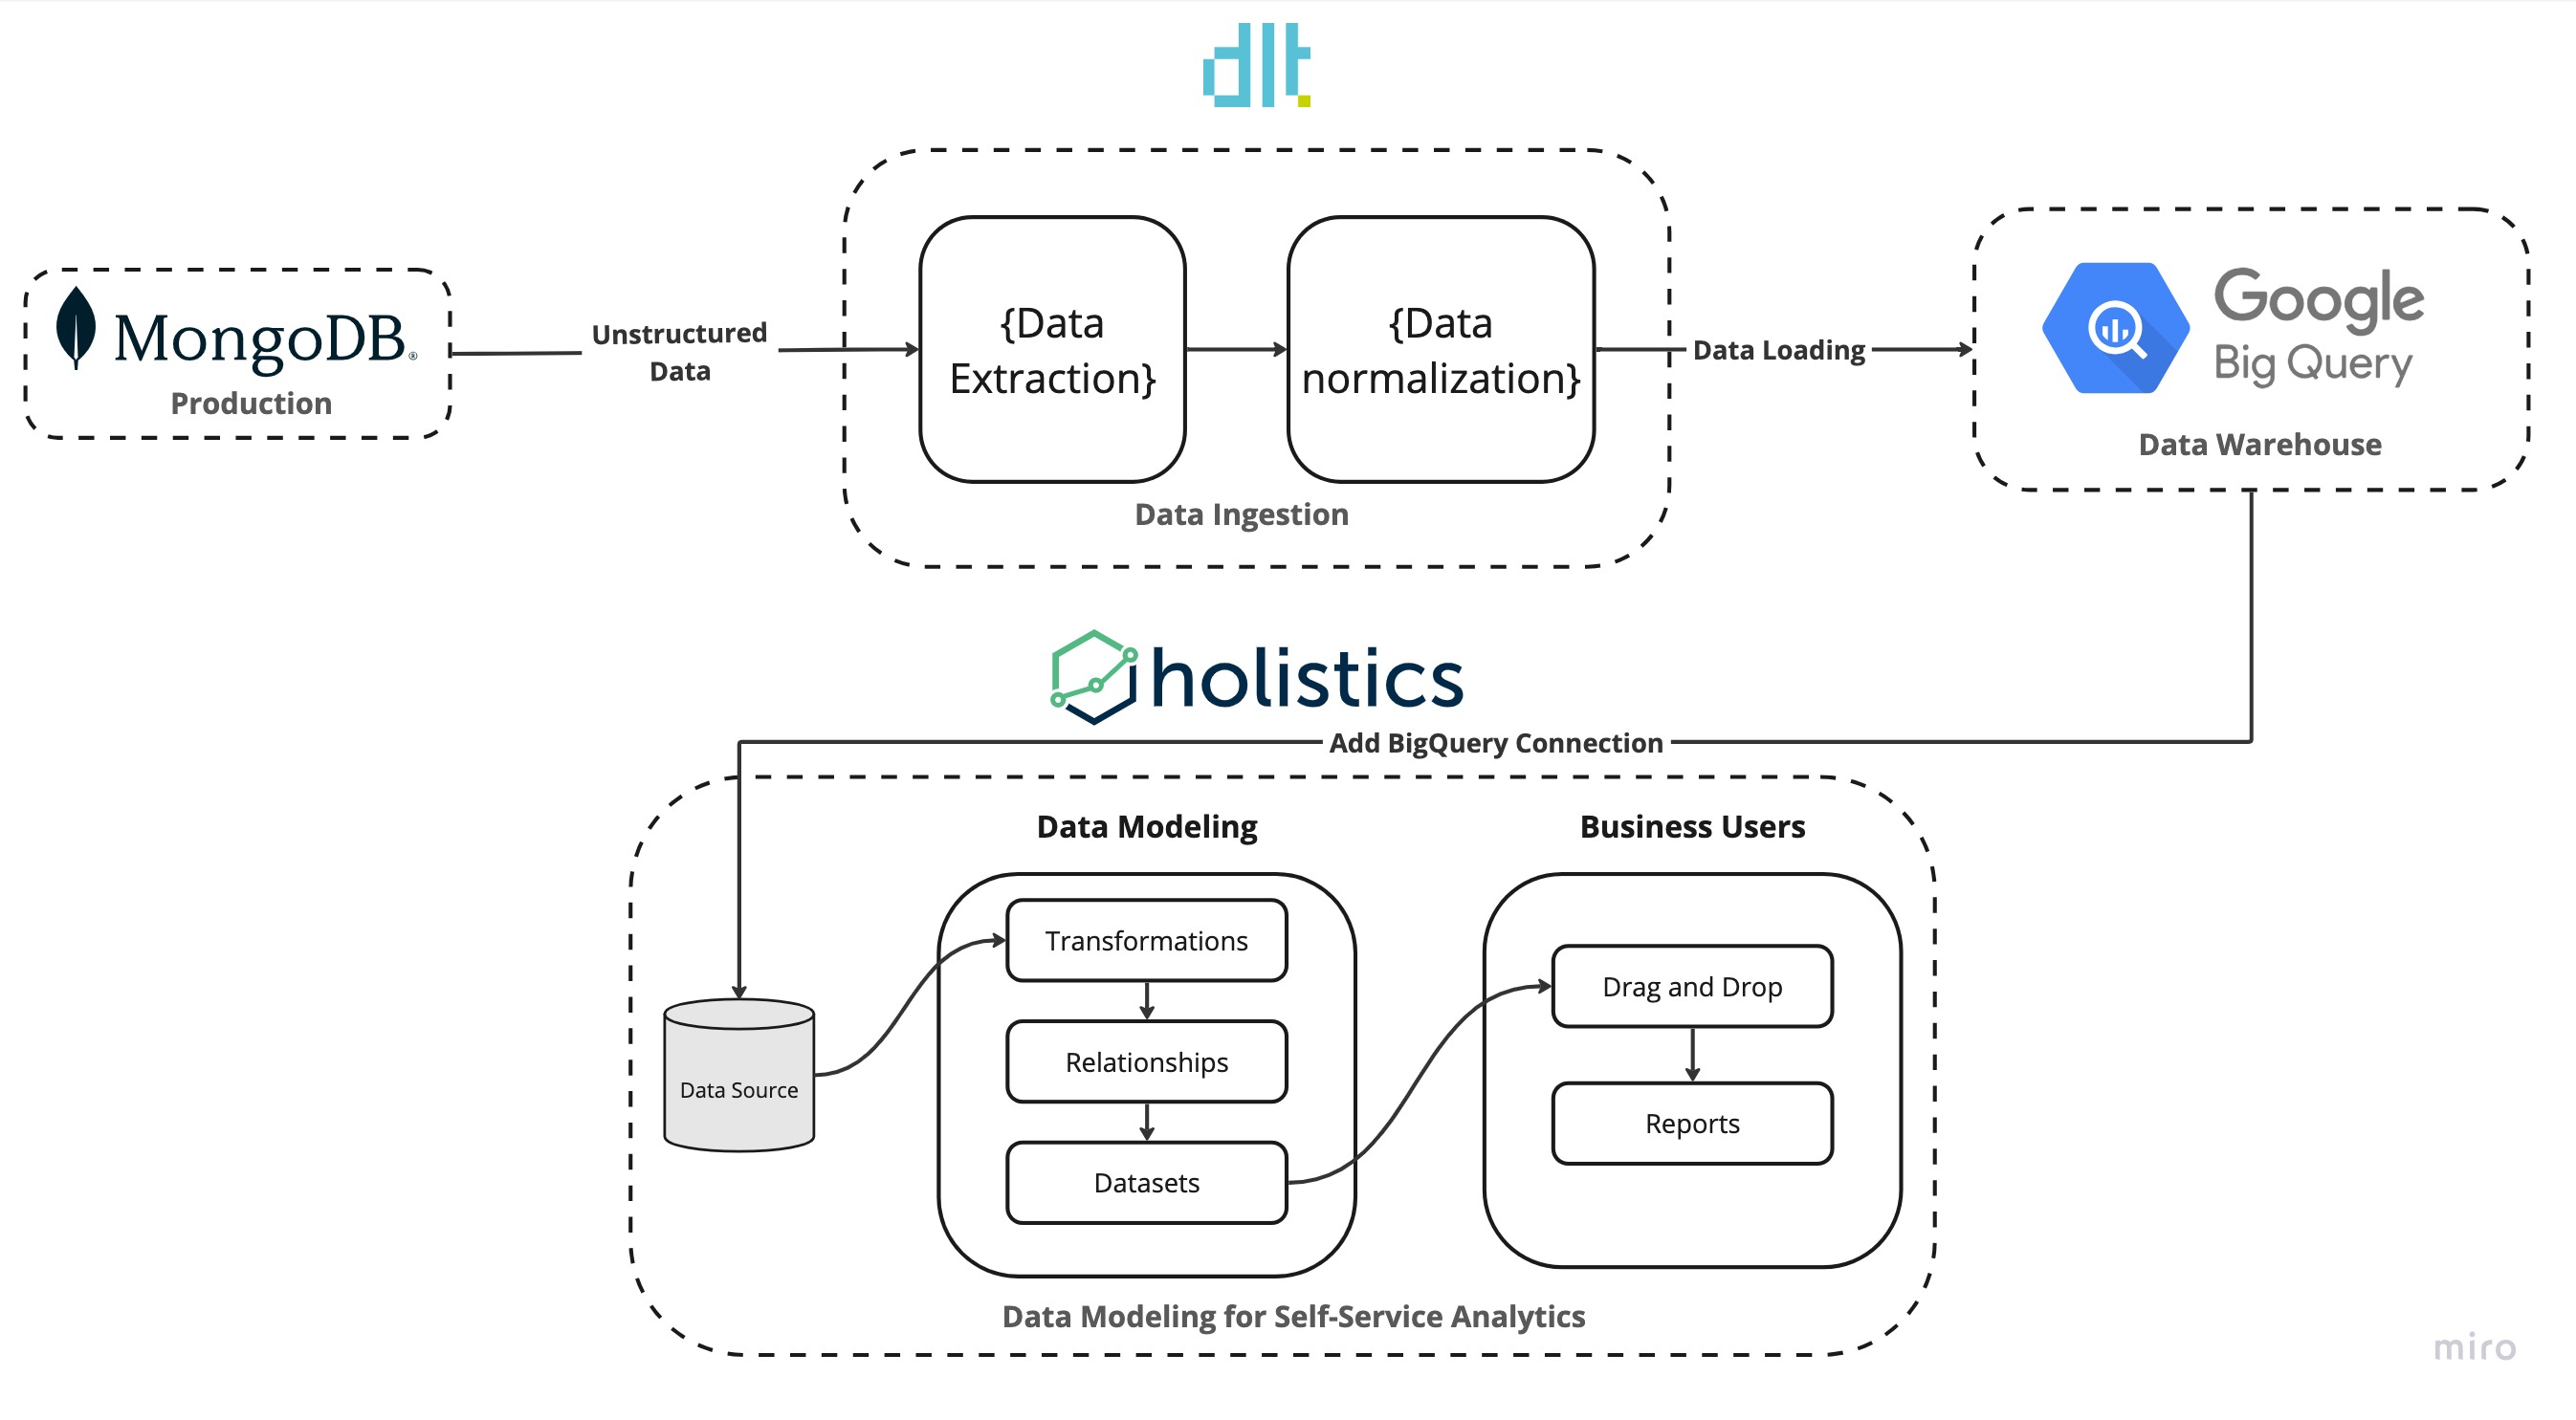
An Overview of the MongoDB Modern Analytics Stack
| Tool | Layer | Why it’s awesome |
|---|---|---|
| MongoDB | Production | Sometimes used as a data dump by CTOs. Often stores unstructured, semi-structured production data that stakeholders want to access. |
| dlt | Data Ingestion | Mongo is great, but then others struggle to analyze the data. dlt extracts data from MongoDB, creates schema in BigQuery, and loads normalized MongoDB data into BigQuery. |
| BigQuery | Data Warehouse | Because of its pricing model, it’s a good data warehouse choice to store structured MongoDB data so it can be used by BI tools like Holistics for self-service analytics. |
| Holistics | Data Modeling for Self-Service Analytics | Holistics makes it easy for data teams to setup and govern an end-user self-service analytics platform using DevOps best practices |
In our stack, dlt resides in the data ingestion layer. It takes in unstructured data from MongoDB normalizes the data and populates it into BigQuery.
In the data modeling layer, Holistics accesses the data from BigQuery builds relationships, transforms the data, and creates datasets to access the transformations. In the reporting layer, Holistics allows stakeholders to self-service their data by utilizing the created datasets to build reports and create visualizations.
MongoDB is loved by CTOs, but its usage creates issues for stakeholders.
NoSQL databases such as MongoDB have gained widespread popularity due to their capacity to store data in formats that align more seamlessly with application usage, necessitating fewer data transformations during storage and retrieval.
MongoDB is optimized for performance and uses BSON (Binary Javascript Object Notation) under the hood as compared to JSON. This allows MongoDB to support custom and more complex data types, such as geospatial data, dates, and regex. Additionally, BSON supports character encodings.
All these benefits enable MongoDB to be a faster and better database, but the advantages of the flexibility offered by MongoDB are sometimes abused by developers and CTOs who use it as a dump for all types of unstructured and semi-structured data. This makes this data inaccessible to stakeholders and unfit for analytics purposes.
Moreover, the unique nature of MongoDB with its BSON types and its usage as a data dump in current times mean that additional hurdles must be crossed before data from MongoDB can be moved elsewhere.
How does our Modern data stack solve the MongoDB problem?
In the data ingestion layer, dlt utilizes the MongoDB verified source to ingest data into BigQuery. Initializing the MongoDB verified source setups default code needed to run the pipeline. We just have to setup the credentials and specify the collections in MongoDB to ingest into BigQuery. Once the pipeline is run dlt takes care of all the steps from extracting unstructured data from MongoDB, normalizing the data, creating schema, and populating the data into BigQuery.
Getting your data cleaned and ingested into a data warehouse is just one part of the analytics pipeline puzzle. Before the data is ready to be used by the entire organization the data team must model the data and document the context of data. This means defining the relationships between tables, adding column descriptions, and implementing the necessary transformations. This is where Holistics shines. With analytics-as-code as first-class citizens, Holistics allows data teams to adopt software engineering best practices in their analytics development workflows. This helps data teams govern a centralized curated set of semantic datasets that any business users can use to extract data from the data warehouse.
Why is dlt useful when you want to ingest data from a production database such as MongoDB?
Writing a Python-based data ingestion pipeline for sources such as MongoDB is quite a tedious task as it involves a lot of overhead to set up. The data needs to be cleaned before it is ready for ingestion. Moreover, MongoDB is a NoSQL database meaning it stores data in a JSON-like data structure. So if you want to query it with SQL natively, you will need to transform this JSON-like data structure into flat tables. Let's look at how this transformation and cleaning can be done:
- Create a Data Model based on the MongoDB data we intend to ingest.
- Create tables in the data warehouse based on the defined Data Model.
- Extract the data from MongoDB and perform necessary transformations such as Data Type conversion (BSON to JSON), and flattening of nested data.
- Insert the transformed data into the corresponding SQL tables.
- Define relationships between tables by setting up primary and foreign keys.
Using the dlt MongoDB verified source we can forgo the above-mentioned steps. dlt takes care of all the steps from transforming the JSON data into relational data, to creating the schema in the SQL database.
To get started with dlt we would need to set some basic configurations, while everything else would be automated. dlt takes care of all the steps from creating schema to transforming the JSON data into relational data. The workflow for creating such a data pipeline in dlt would look something like this:
- Initialize a MongoDB source to copy the default code.
- Set up the credentials for the source and destination.
- Define the MongoDB collection to ingest (or default to all).
- Optionally configure incremental loading based on source logic.
What is useful about Holistics in this project?
Holistics is a Business Intelligence platform with the goal of enabling self-service analytics for entire organizations. Holistics works by connecting to an SQL data warehouse. This allows it to build SQL queries and execute them against the data warehouse. In essence, Holistics utilizes the storage and processing capabilities of the data warehouse and the data never leaves the data warehouse.
To enable self-service Holistics introduces a modeling layer. The data teams use this layer to define table relationships, data transformations, metrics, and data logic. The entire organization can utilize these metrics and data logic defined in this layer to self-service their data needs.
In addition to the transformation layer, Holistics provides advanced features such as defining models using code through Holistics’ analytics-as-code languages (AMQL) and utilizing Git version control systems to manage code changes. Moreover, data teams can integrate with dbt to streamline the data transformations.
The overall Holistics workflow looks something like this:

- Connect Holistics to an existing SQL data warehouse.
- Data teams use Holistics Data Modeling to model and transform analytics data. This model layer is reusable across reports & datasets.
- Non-technical users can self-service explore data based on predefined datasets prepared by data teams. They can save their explorations into dashboards for future use.
- Dashboards can be shared with others, or pushed to other platforms (email, Slack, webhooks, etc.).
Code Walkthrough
In this section, we walk through how to set up a MongoDB data pipeline using dlt. We will be using the MongoDB verified source you can find here.
1. Setting up the dlt pipeline
Use the command below to install dlt.
pip3 install -U dlt
Consider setting up a virtual environment for your projects and installing the project-related libraries and dependencies inside the environment. For best installation practices visit the dlt installation guide.
Once we have dlt installed, we can go ahead and initialize a verified MongoDB pipeline with the destination set to Google BigQuery. First, create a project directory and then execute the command below:
dlt init mongodb bigquery
The above command will create a local ready-made pipeline that we can customize to our needs. After executing the command your project directory will look as follows:
.
├── .dlt
│   ├── config.toml
│   └── secrets.toml
├── mongodb
│   ├── README.md
│   ├── __init__.py
│   └── helpers.py
├── mongodb_pipeline.py
└── requirements.txt
The __init__.py file in the mongodb directory contains dlt functions we call resources that yield the data from MongoDB. The yielded data is passed to a dlt.pipeline that normalizes the data and forms the connection to move the data to your destination. To get a better intuition of the different dlt concepts have a look at the docs.
As the next step, we set up the credentials for MongoDB. You can find detailed information on setting up the credentials in the MongoDB verified sources documentation.
We also need to set up the GCP service account credentials to get permissions to BigQuery. You can find detailed explanations on setting up the service account in the dlt docs under Destination Google BigQuery.
Once all the credentials are set add them to the secrets.toml file. Your file should look something like this:
# put your secret values and credentials here. do not share this file and do not push it to github
[sources.mongodb]
connection_url = "mongodb+srv://<user>:<password>@<cluster_name>.cvanypn.mongodb.net" # please set me up!
database = "sample_mflix"

[destination.bigquery]
location = "US"
[destination.bigquery.credentials]
project_id = "analytics" # please set me up!
private_key = "very secret can't show"
client_email = "<org_name>@analytics.iam.gserviceaccount.com" # please set me up!
The mongodb_pipeline.py at the root of your project directory is the script that runs the pipeline. It contains many functions that provide different ways of loading the data. The selection of the function depends on your specific use case, but for this demo, we try to keep it simple and use the load_entire_database function.
def load_entire_database(pipeline: Pipeline = None) -> LoadInfo:
    """Use the mongo source to completely load all collection in a database"""
    if pipeline is None:
        # Create a pipeline
        pipeline = dlt.pipeline(
            pipeline_name="local_mongo",
            destination='bigquery',
            dataset_name="mongo_database",
        )

    # By default the mongo source reflects all collections in the database
    source = mongodb()

    # Run the pipeline. For a large db this may take a while
    info = pipeline.run(source, write_disposition="replace")

    return info
Before we execute the pipeline script let's install the dependencies for the pipeline by executing the requirements.txt file.
pip install -r requirements.txt
Finally, we are ready to execute the script. In the main function uncomment the load_entire_database function call and run the script.
python mongodb_pipeline.py
If you followed the instructions correctly the pipeline should run successfully and the data should be loaded in Google BigQuery.
2. The result: Comparing MongoDB data with the data loaded in BigQuery.
To get a sense of what we accomplished let's examine what the unstructured data looked like in MongoDB against what is loaded in BigQuery. Below you can see the sample document in MongoDB.
{
    "_id": {
        "$oid": "573a1390f29313caabcd42e8"
    },
    "plot": "A group of bandits stage a brazen train hold-up, only to find a determined posse hot on their heels.",
    "genres": [
        "Short",
        "Western"
    ],
    "runtime": {
        "$numberInt": "11"
    },
    "cast": [
        "A.C. Abadie",
        "Gilbert M. 'Broncho Billy' Anderson",
        "George Barnes",
        "Justus D. Barnes"
    ],
    "poster": "https://m.media-amazon.com/images/M/MV5BMTU3NjE5NzYtYTYyNS00MDVmLWIwYjgtMmYwYWIxZDYyNzU2XkEyXkFqcGdeQXVyNzQzNzQxNzI@._V1_SY1000_SX677_AL_.jpg",
    "title": "The Great Train Robbery",
    "fullplot": "Among the earliest existing films in American cinema - notable as the first film that presented a narrative story to tell - it depicts a group of cowboy outlaws who hold up a train and rob the passengers. They are then pursued by a Sheriff's posse. Several scenes have color included - all hand tinted.",
    "languages": [
        "English"
    ],
    "released": {
        "$date": {
            "$numberLong": "-2085523200000"
        }
    },
    "directors": [
        "Edwin S. Porter"
    ],
    "rated": "TV-G",
    "awards": {
        "wins": {
            "$numberInt": "1"
        },
        "nominations": {
            "$numberInt": "0"
        },
        "text": "1 win."
    },
    "lastupdated": "2015-08-13 00:27:59.177000000",
    "year": {
        "$numberInt": "1903"
    },
    "imdb": {
        "rating": {
            "$numberDouble": "7.4"
        },
        "votes": {
            "$numberInt": "9847"
        },
        "id": {
            "$numberInt": "439"
        }
    },
    "countries": [
        "USA"
    ],
    "type": "movie",
    "tomatoes": {
        "viewer": {
            "rating": {
                "$numberDouble": "3.7"
            },
            "numReviews": {
                "$numberInt": "2559"
            },
            "meter": {
                "$numberInt": "75"
            }
        },
        "fresh": {
            "$numberInt": "6"
        },
        "critic": {
            "rating": {
                "$numberDouble": "7.6"
            },
            "numReviews": {
                "$numberInt": "6"
            },
            "meter": {
                "$numberInt": "100"
            }
        },
        "rotten": {
            "$numberInt": "0"
        },
        "lastUpdated": {
            "$date": {
                "$numberLong": "1439061370000"
            }
        }
    },
    "num_mflix_comments": {
        "$numberInt": "0"
    }
}
This is a typical way data is structured in a NoSQL database. The data is in a JSON-like format and contains nested data. Now, let's look at what is loaded in BigQuery. Below you can see the same data in BigQuery.

The ddl (data definition language) for the movies table in BigQuery can be seen below:
CREATE TABLE `dlthub-analytics.mongo_database.movies`
(
  _id STRING NOT NULL,
  plot STRING,
  runtime INT64,
  poster STRING,
  title STRING,
  fullplot STRING,
  released TIMESTAMP,
  rated STRING,
  awards__wins INT64,
  awards__nominations INT64,
  awards__text STRING,
  lastupdated TIMESTAMP,
  year INT64,
  imdb__rating FLOAT64,
  imdb__votes INT64,
  imdb__id INT64,
  type STRING,
  tomatoes__viewer__rating FLOAT64,
  tomatoes__viewer__num_reviews INT64,
  tomatoes__viewer__meter INT64,
  tomatoes__fresh INT64,
  tomatoes__critic__rating FLOAT64,
  tomatoes__critic__num_reviews INT64,
  tomatoes__critic__meter INT64,
  tomatoes__rotten INT64,
  tomatoes__last_updated TIMESTAMP,
  num_mflix_comments INT64,
  _dlt_load_id STRING NOT NULL,
  _dlt_id STRING NOT NULL,
  tomatoes__dvd TIMESTAMP,
  tomatoes__website STRING,
  tomatoes__production STRING,
  tomatoes__consensus STRING,
  metacritic INT64,
  tomatoes__box_office STRING,
  imdb__rating__v_text STRING,
  imdb__votes__v_text STRING,
  year__v_text STRING
);
If you compare the ddl against the sample document in MongoDB you will notice that the nested arrays such as CAST are missing from the ddl in BigQuery. This is because of how dlt handles nested arrays. If we look at our database in BigQuery you can see the CAST is loaded as a separate table.
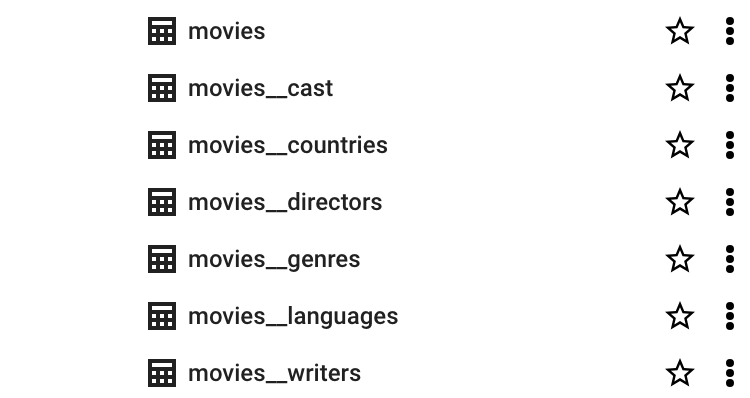
dlt normalises nested data by populating them in separate tables and creates relationships between the tables, so they can be combined together using normal SQL joins. All this is taken care of by dlt and we need not worry about how transformations are handled. In short, the transformation steps we discussed in Why is dlt useful when you want to ingest data from a production database such as MongoDB? are taken care of by dlt, making the data analyst's life easier.
To better understand how dlt does this transformation, refer to the docs.
3. Self-service analytics for MongoDB with Holistics.
After dlt ingests the data into your data warehouse, you can connect Holistics to the data warehouse and model, govern, and set up your self-service analytics platform for end-user consumption.
By combining dlt with Holistics we get the best of both worlds. The flexibility of an open source library for data ingestion that we can customize based on changing data needs, and a self-service BI tool in Holistics that can not only be used for analytics but also introduces a data modeling layer where metrics and data logic can be defined. Holistics also has support for Git version control to track code changes and can integrate with dbt for streamlining data transformations.
We took care of the data ingestion step in the previous section. We can now connect to our SQL data warehouse, and start transforming the data using the modeling layer in Holistics. We will be using the newest version of Holistics, Holistics 4.0 for this purpose.
In Holistics, add a new data source click on the plus sign (+) on the top menu, and then select Connect Data Sources. Select New Data Sources and in the database type select Google BigQuery. We need to provide the service account credentials that were generated above when we connected dlt to BigQuery. For more detailed instructions on connecting BigQuery to Hollistics refer to this guide.
Once the BigQuery source is added we are ready to import the schemas from BigQuery into Holistics. The schema(dataset_name) name under which dlt loaded the MongoDB data is defined in the load_entire_database function when we create the MongoDB pipeline.
# Create a pipeline
pipeline = dlt.pipeline(
    pipeline_name="local_mongo",
    destination='bigquery',
    dataset_name="mongo_database", # Schema Name
)
4. Modeling the Data and Relationships with Holistics.
To use the data, we will define a data model and the join paths that Holistics can use to build the semantic datasets.
A data model is an abstract view on top of a physical database table that you may manipulate without directly affecting the underlying data. It allows you to store additional metadata that may enrich the underlying data in the data table.
In Holistics, go to the Modelling 4.0 section from the top bar. We will be greeted with the Start page as we have created no models or datasets. We will turn on the development mode from the top left corner. The development model will allow you to experiment with the data without affecting the production datasets and reporting. To keep things organized let’s create two folders called Models and Datasets.
Adding Holistics Data Model(s):
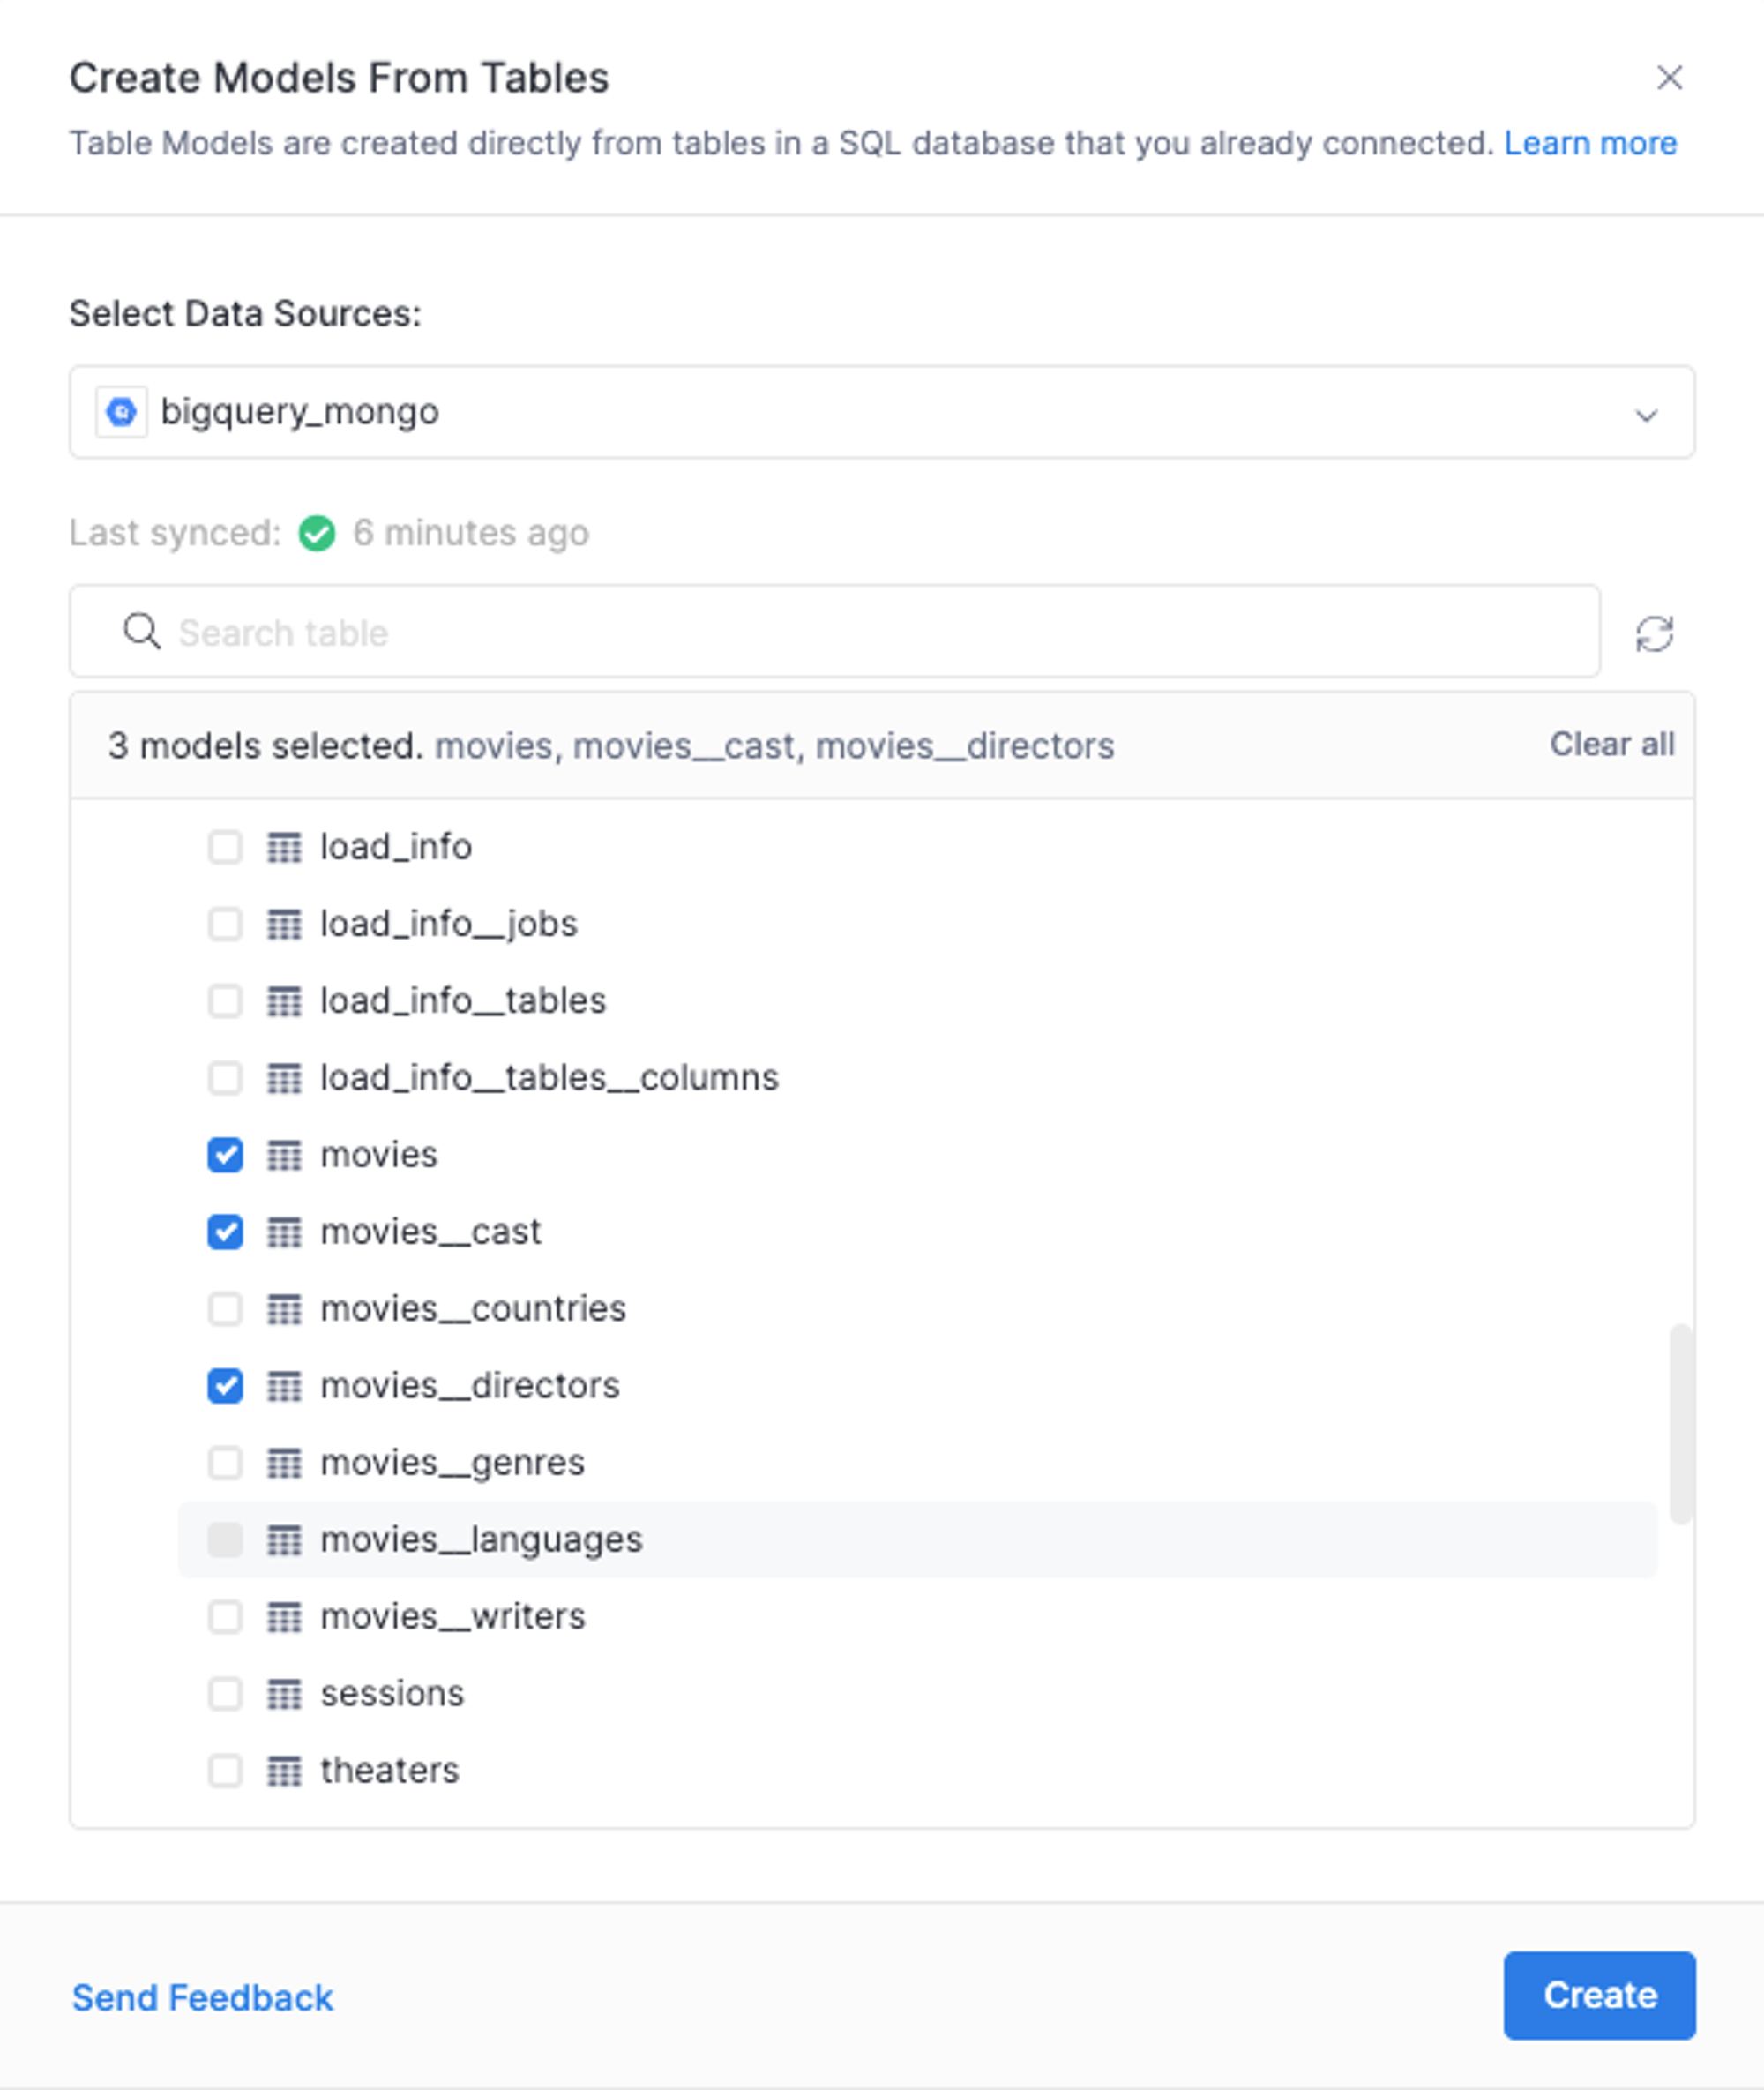
Under the Models folder, let's add the MongoDB data from BigQuery as Table Models. Hover over the Models folder and click on the (+) sign then select Add Table Model. In the Data Sources select the BigQuery Source we created before and then select the relevant table models to import into Holistics. In this case, we are importing the movies, movies_cast and movies_directors tables.
Adding Holistics Dataset(s) and Relationships:
After the Data Models have been added, we can create a Dataset with these models and use them for reporting.
A Dataset is a "container" holding several Data Models together so they can be explored together, and dictating which join path to be used in a particular analytics use case.
Datasets works like a data marts, except that it exists only on the semantic layer. You publish these datasets to your business users to let them build dashboards, or explore existing data.
Hover over the Datasets folder, click on the (+) sign, and then select Add Datasets. Select the previously created Table Models under this dataset, and Create Dataset.
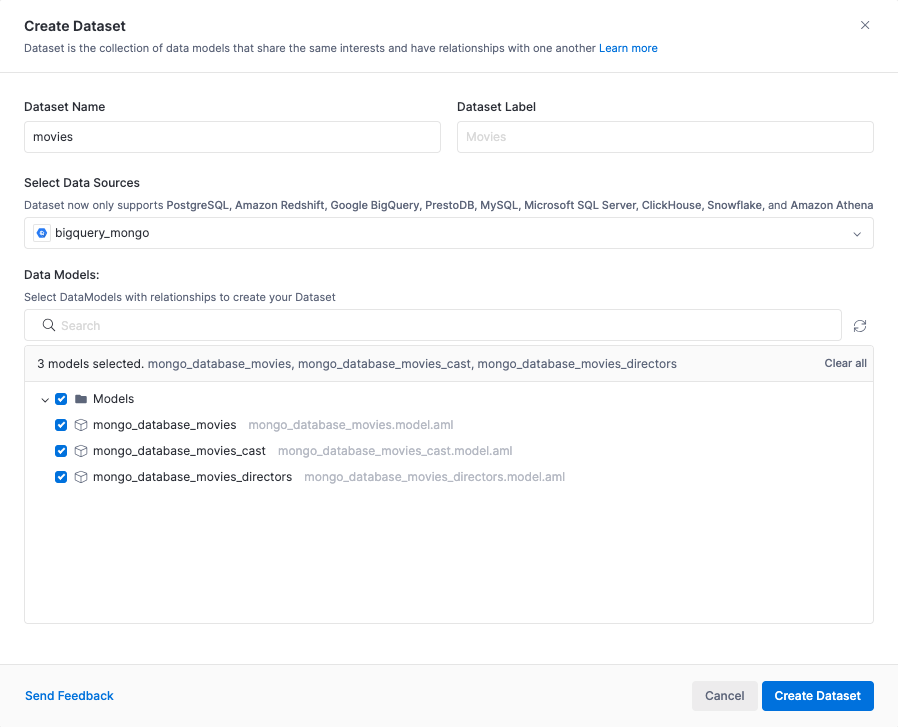
We will then be asked to create relationships between the models. We create a Many-to-one (n - 1) relationship between the cast and the movies models.

The resulting relationship can seen As Code using the Holistics 4.0 Analytics as Code feature. To activate this feature click on the newly created dataset and select the View as Code option from the top right. For more detailed instructions on setting up relationships between models refer to the model relationship guide.
Previously, we created the relationship between the cast and the movies tables using GUI, now let’s add the relationship between the directors and movies tables using the Analytics as Code feature. In the dataset.aml file append the relationships block with the following line of code:
relationship(model__mongo_database_movies_directors.dlt_parent_id > model__mongo_database_movies.dlt_id, true)
After the change, the dataset.aml file should look like this:
import '../Models/mongo_database_movies.model.aml' {
  mongo_database_movies as model__mongo_database_movies
}
import '../Models/mongo_database_movies_cast.model.aml' {
  mongo_database_movies_cast as model__mongo_database_movies_cast
}
import '../Models/mongo_database_movies_directors.model.aml' {
  mongo_database_movies_directors as model__mongo_database_movies_directors
}

Dataset movies {
  label: 'Movies'
  description: ''
  data_source_name: 'bigquery_mongo'
  models: [
    model__mongo_database_movies,
    model__mongo_database_movies_cast,
    model__mongo_database_movies_directors
  ]
  relationships: [
    relationship(model__mongo_database_movies_cast.dlt_parent_id > model__mongo_database_movies.dlt_id, true),
    relationship(model__mongo_database_movies_directors.dlt_parent_id > model__mongo_database_movies.dlt_id, true)
    ]
  owner: 'zaeem@dlthub.com'
}
The corresponding view for the dataset.aml file in the GUI looks like this:
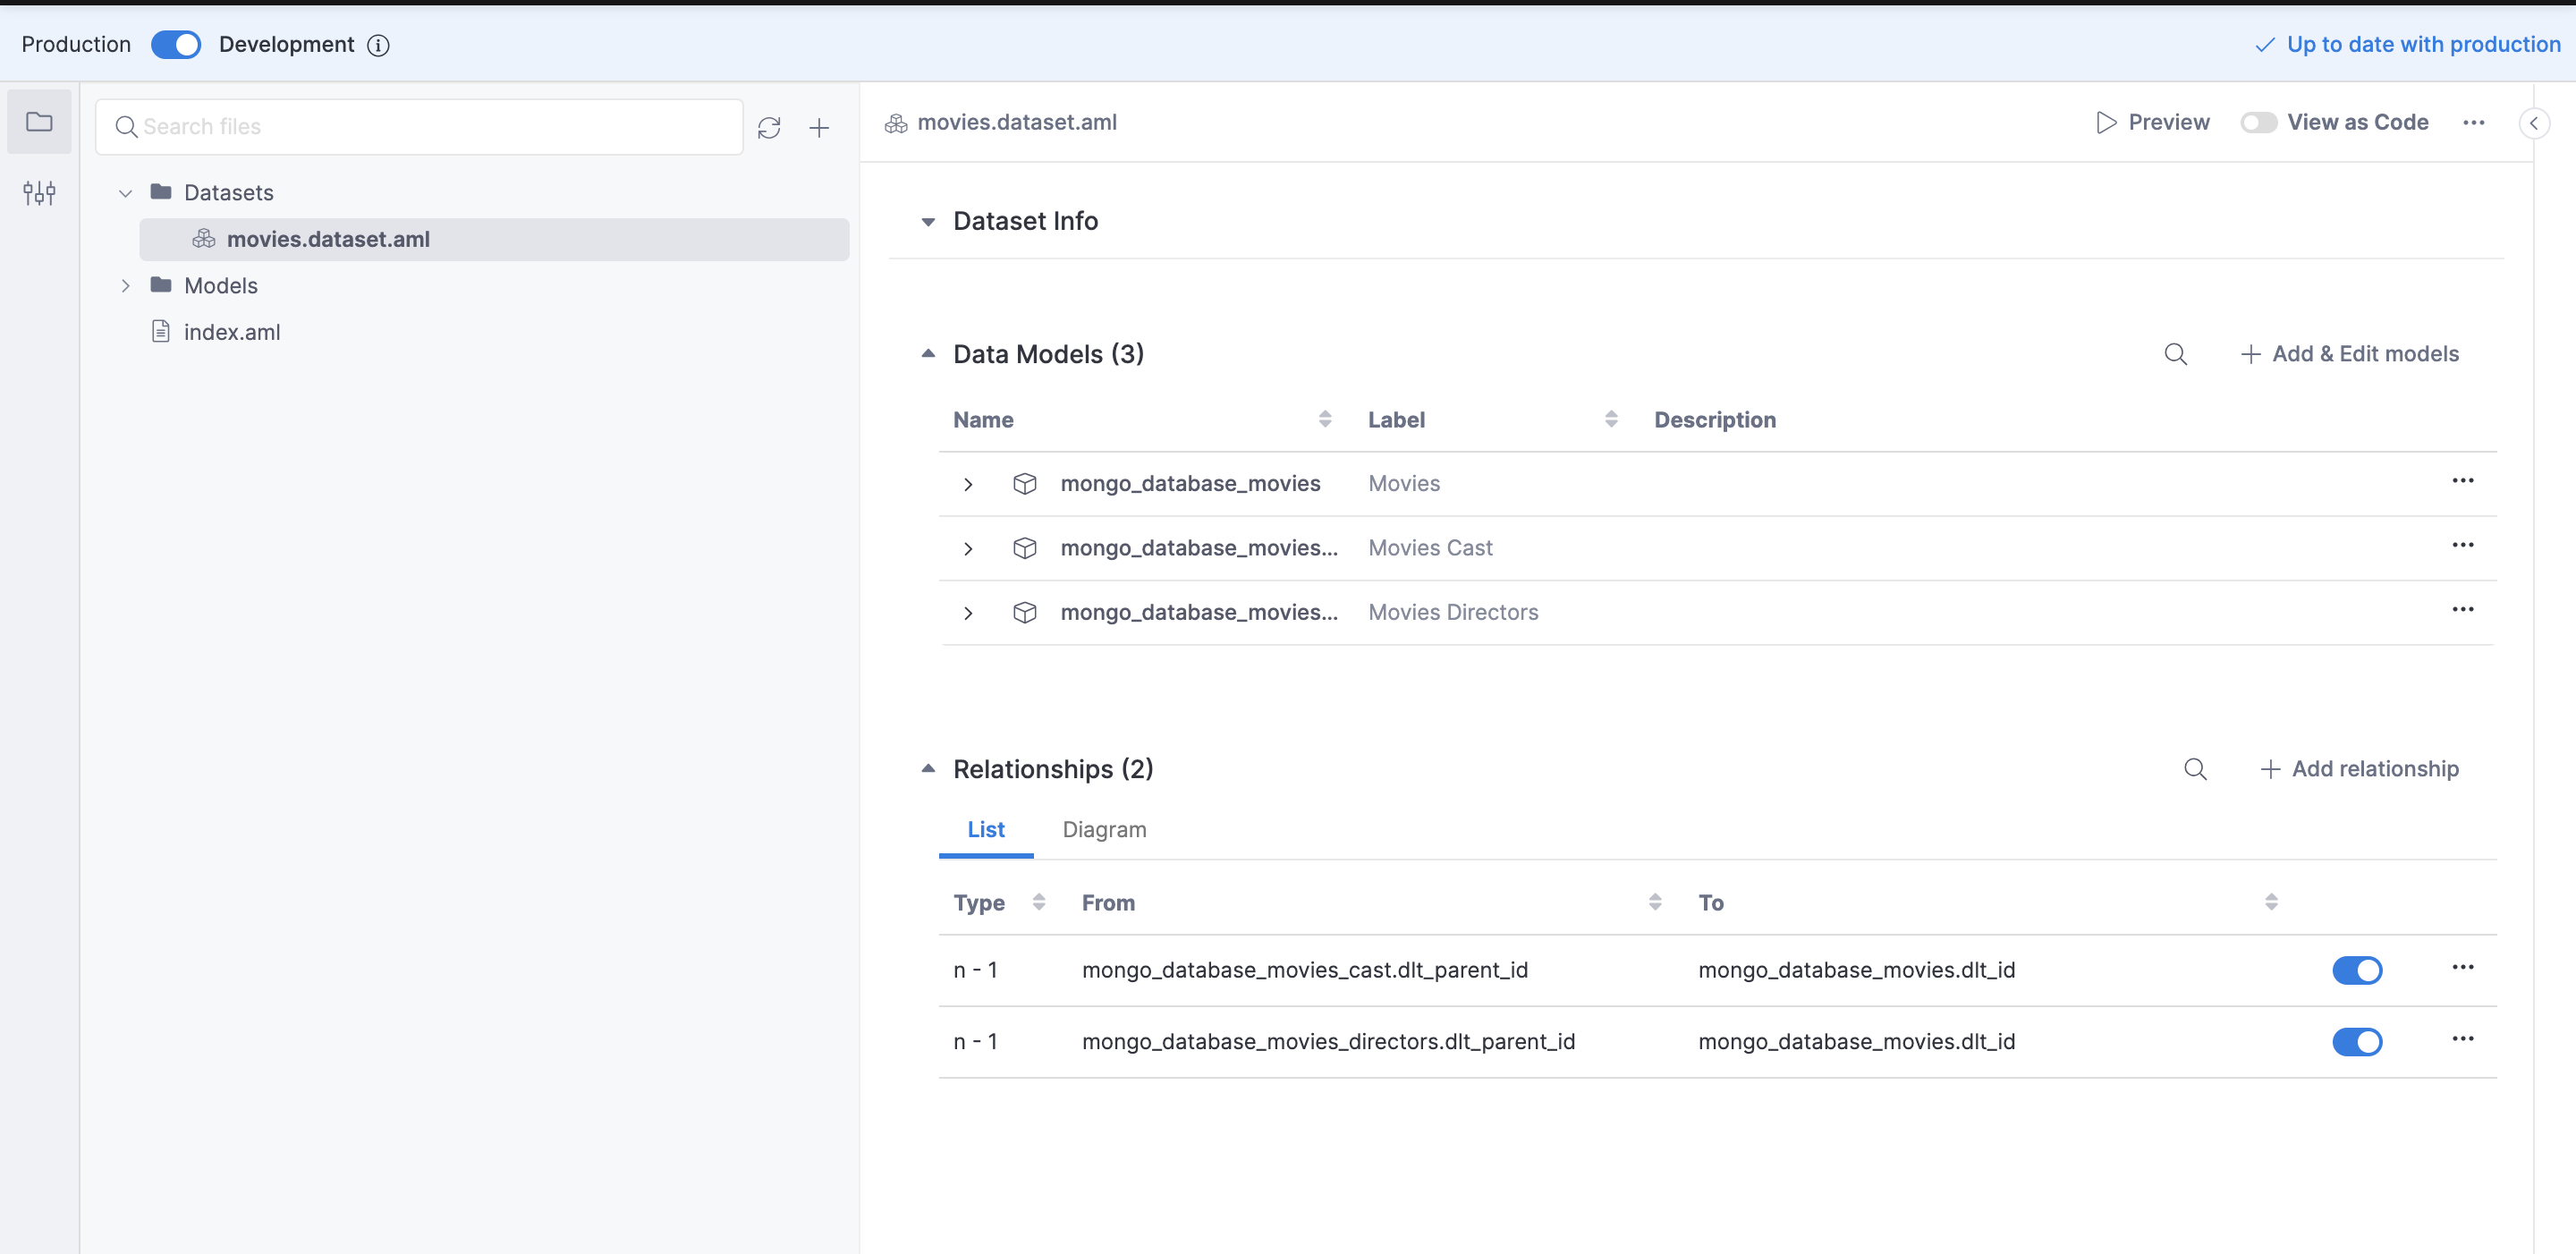
Once the relationships between the tables have been defined we are all set to create some visualizations. We can select the Preview option from next to the View as Code toggle to create some visualization in the development mode. This comes in handy if we have connected an external git repository to track our changes, this way we could test out the dataset in preview mode before committing and pushing changes, and deploying the dataset to production.
In the current scenario, we will just directly deploy the dataset to production as we have not integrated a Git Repository. For more information on connecting a Git Repository refer to the Holistics docs.
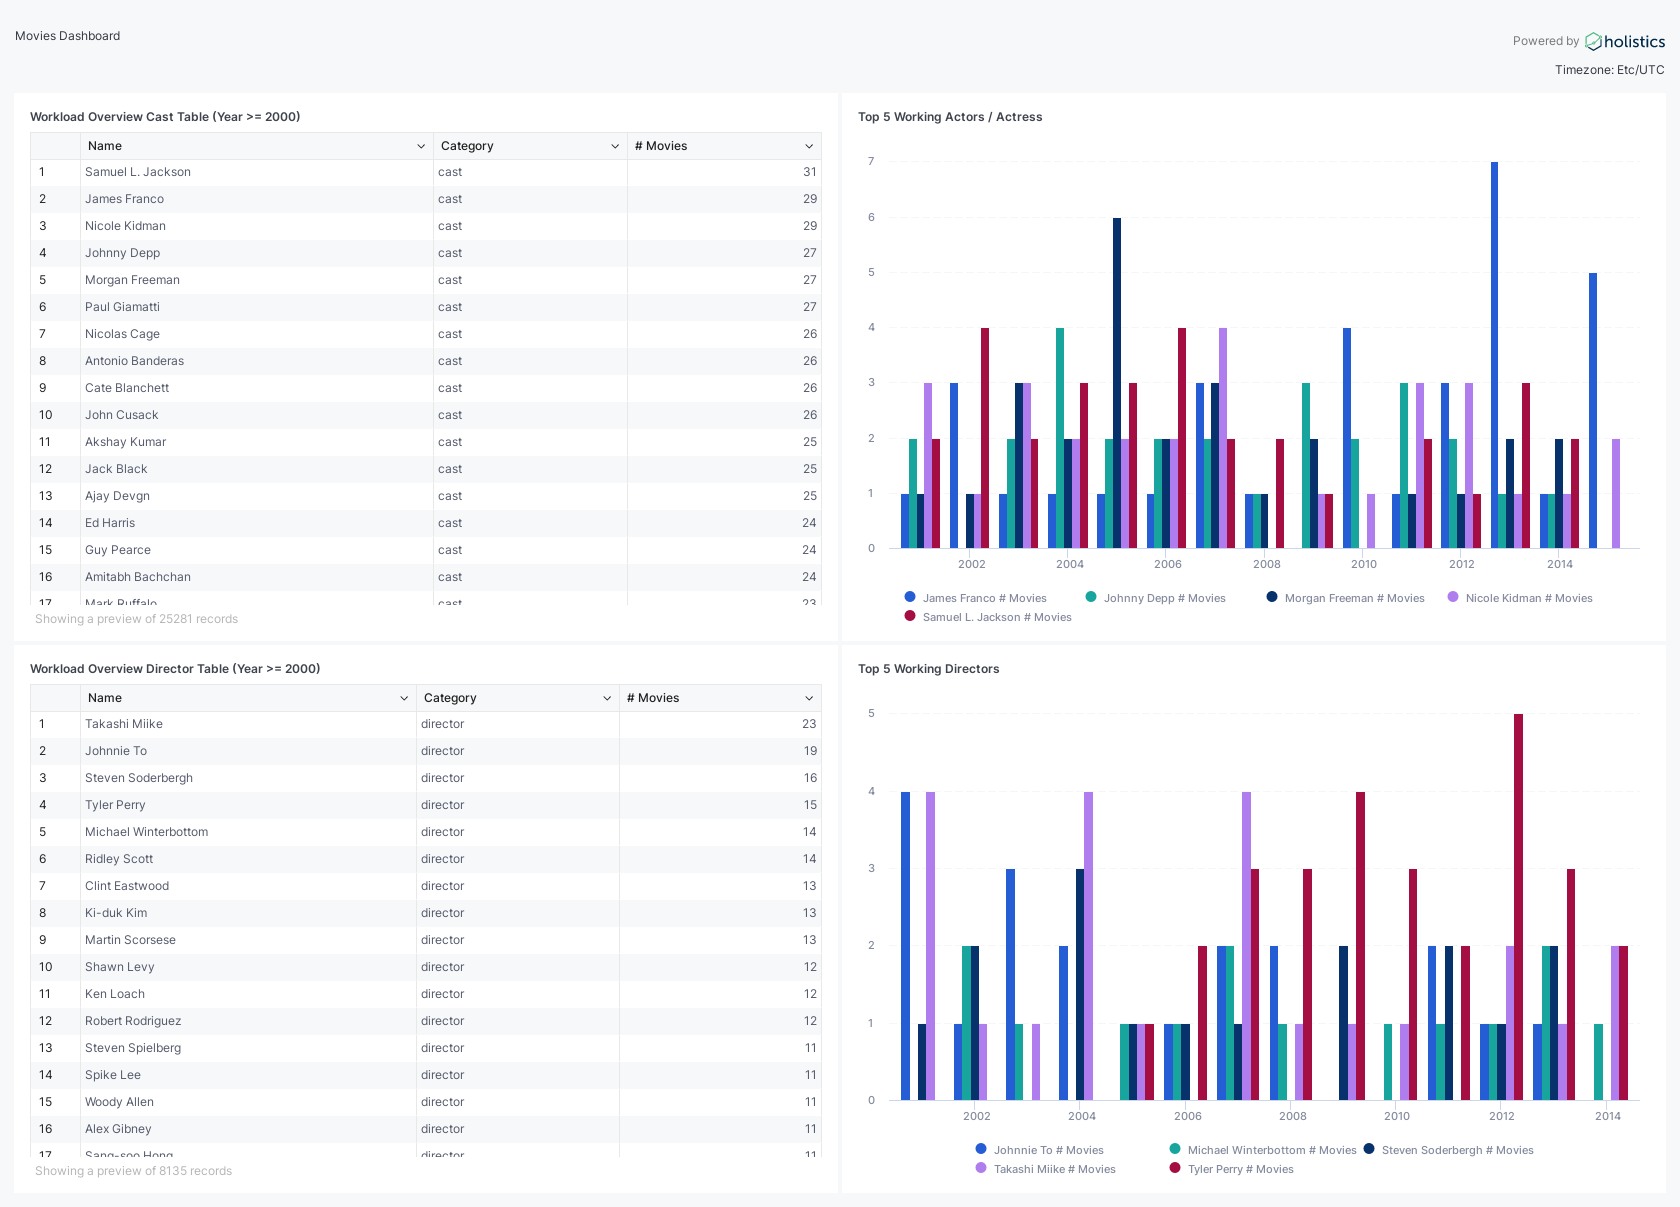
The Movies dataset should now be available in the Reporting section. We will create a simple visualization that shows the workload of the cast and directors. In simple words, How many movies did an actor or director work on in a single year?
Visualization and Self-Service Analytics with Holistics:
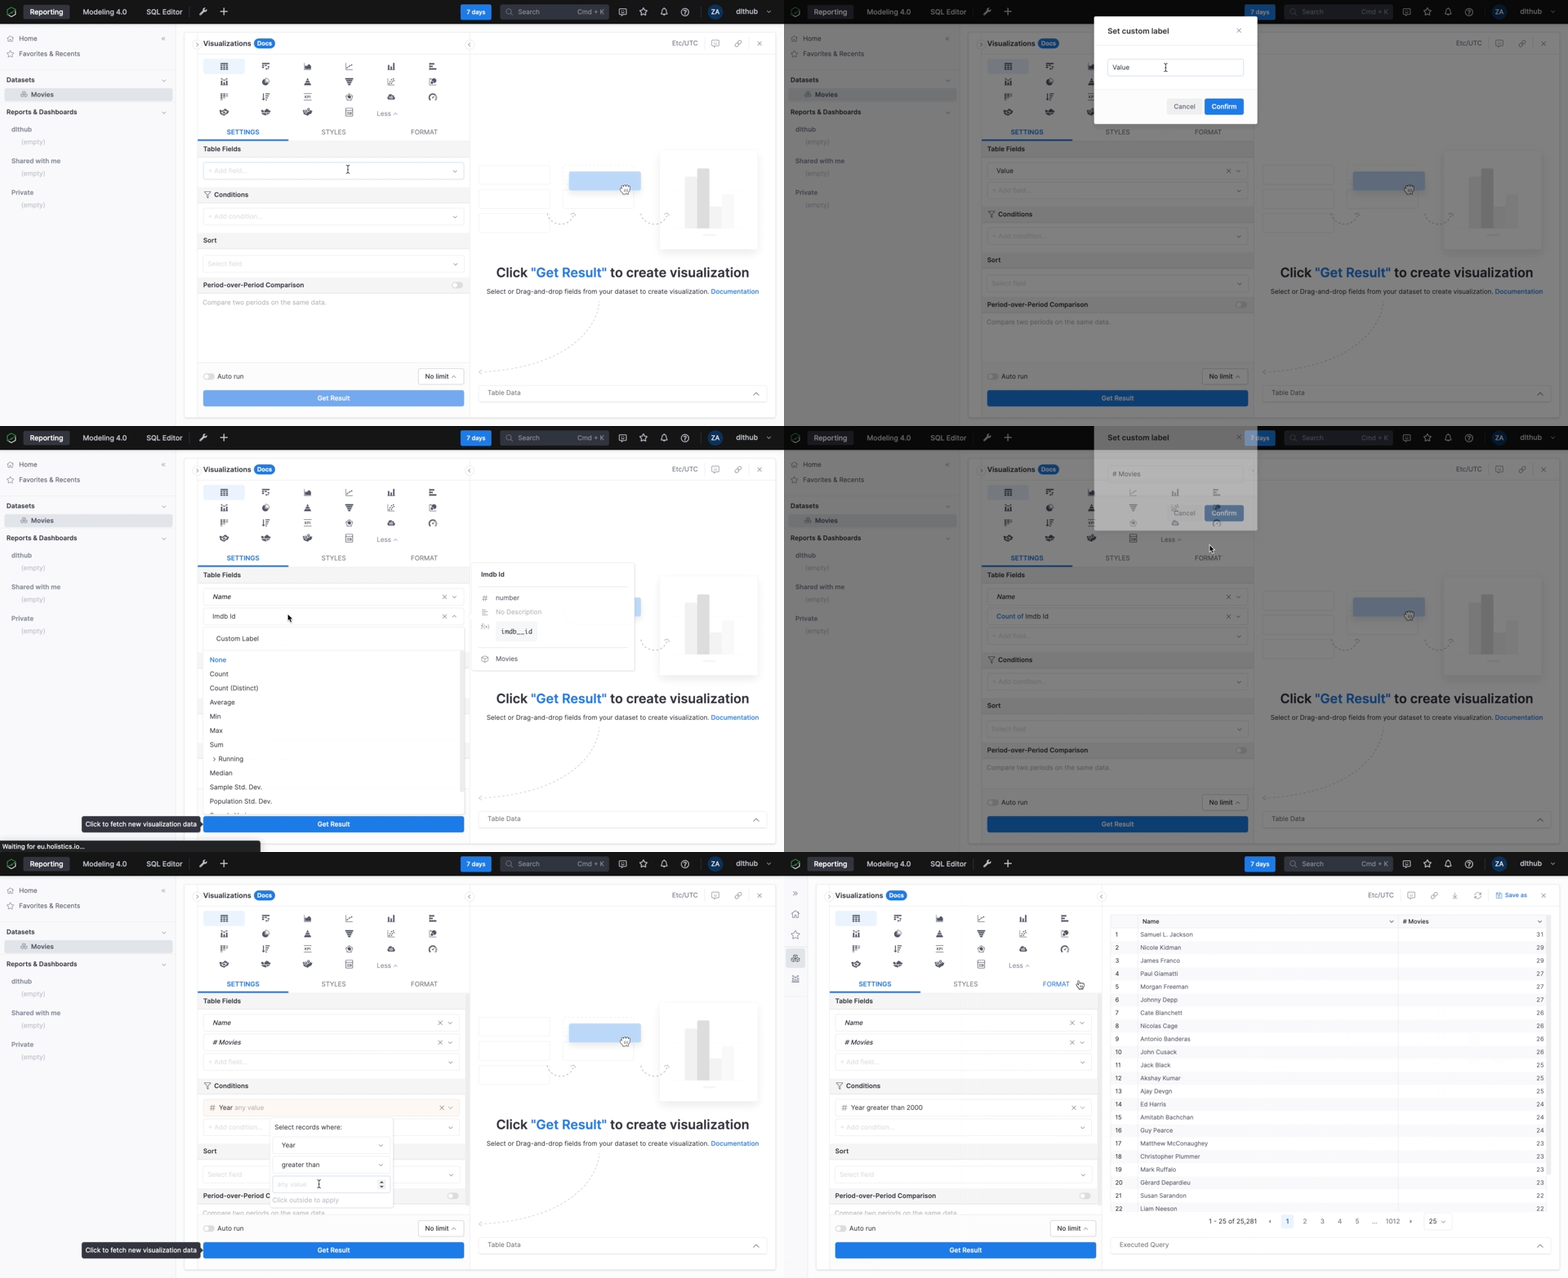
The visualization part is pretty self-explanatory and is mostly drag and drop as we took the time to define the relationships between the tables. Below we create a simple table in Holistics that shows the actors that have appeared in most movies since the year 2000.
Similarly, we can add other reports and combine them into a dashboard. The resulting dashboard can be seen below:
Conclusion
In this blog, we have introduced a modern data stack that uses dlt and Holistics to address the MongoDB data accessibility issue.
We leverage dlt, to extract, normalize, create schemas, and load data into BigQuery, making it more structured and accessible. Additionally, Holistics provides the means to transform and model this data, adding relationships between various datasets, and ultimately enabling self-service analytics for the broader range of stakeholders in the organization.
This modern data stack offers an efficient and effective way to bridge the gap between MongoDB's unstructured data storage capabilities and the diverse needs of business, operations, and data science professionals, thereby unlocking the full potential of the data within MongoDB for the entire Company.
Additional Resources:
- Want to discuss
dlt? Join thedltSlack Community - Check out our friends over at Holistics.
dltMongoDB Source.- Holistics 4.0: Analytics as Code.
- Holistics: Data Modelling.
- Holistics: Model Relationship.
- Holistics 4.0: Production vs. Development Mode.
- Holistics 4.0: Git Version Control.
- Holistics 4.0: dbt Integration.
